Why Text-to-SQL Accuracy Slips from 91.2% to 21.3% on Real Company Data
Text-to-SQL scores 91.2% on the benchmark everyone quotes and 21.3% on the one built from enterprise warehouses. The gap is implicit joins, and a semantic model is where they get declared.

On text-to-SQL accuracy · 8 min read
Why Text-to-SQL Accuracy Slips from 91.2% to 21.3% on Real Company Data
Text to SQL accuracy is high on the benchmarks everyone quotes and collapses on the warehouses people actually own. The two numbers come from the same code agent, and the thing that changed between them is not the model. It is whether anyone declared the joins.
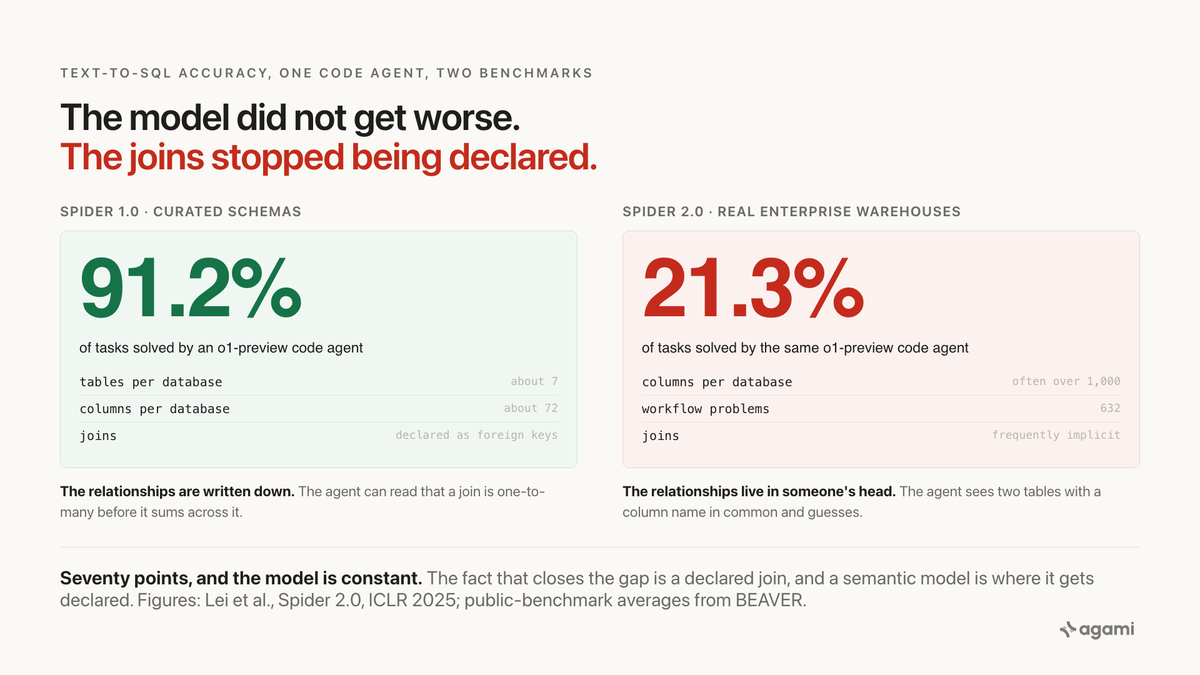
Most AI data tools show an accuracy number somewhere in the deck. Those numbers usually come from public text-to-SQL benchmarks, and on those the field has done well. One o1-preview code agent solves 91.2% of Spider 1.0 and 73.0% of BIRD, according to the Spider 2.0 paper that measured it (Lei et al., ICLR 2025). Point the same agent at Spider 2.0, which is built from real enterprise warehouse workflows, and it solves 21.3%.
Same agent. Same paper. Seventy points of difference. Nothing about the model got worse between the two rows of that table, so the explanation has to be in the data.
A second measurement lands in the same place. Anthropic measured Claude against their own production warehouse and report that accuracy without a semantic layer "didn't exceed 21%" (Anthropic). Two different teams, two different models, one a benchmark and one a company's own warehouse, landing in the same place.
What changed between the benchmarks
The Spider 2.0 authors are specific about what makes their benchmark different, and the BEAVER paper from the same year measures the same distance from the other side. Three things move at once.
The schema gets wide. Public text-to-SQL benchmarks average about 6.8 tables and 72.5 columns per database, per the BEAVER paper. Spider 2.0 databases often carry more than 1,000 columns, per Lei et al. That changes the task. At 72 columns a model can hold the schema in view; at 1,000 it's choosing which part to look at, and the choice is where errors enter.
The questions get long. Enterprise queries in BEAVER average 316.7 tokens against 37.3 in BIRD, per the same paper. A 37-token query is one join and one filter. A 317-token query is a path through the schema, and every hop in that path is a place to pick the wrong table.
The joins stop being declared. This is the one that explains the other two. BEAVER's authors name it directly as a cause of the gap: in real warehouses, join relationships are frequently implicit rather than declared as foreign keys, per arXiv:2409.02038. A public benchmark ships its schema with the relationships written down. A replicated enterprise warehouse does not, and the model has to infer them from column names.
BEAVER's own headline number shows how much that costs. Agentic frameworks on GPT-5.2 reach 10.8% on its private-warehouse questions. Hand the same frameworks oracle subtask hints, which is to say tell them which tables and joins the answer needs, and they reach 30.1%, per arXiv:2409.02038. The hint supplies the declaration the schema was missing.
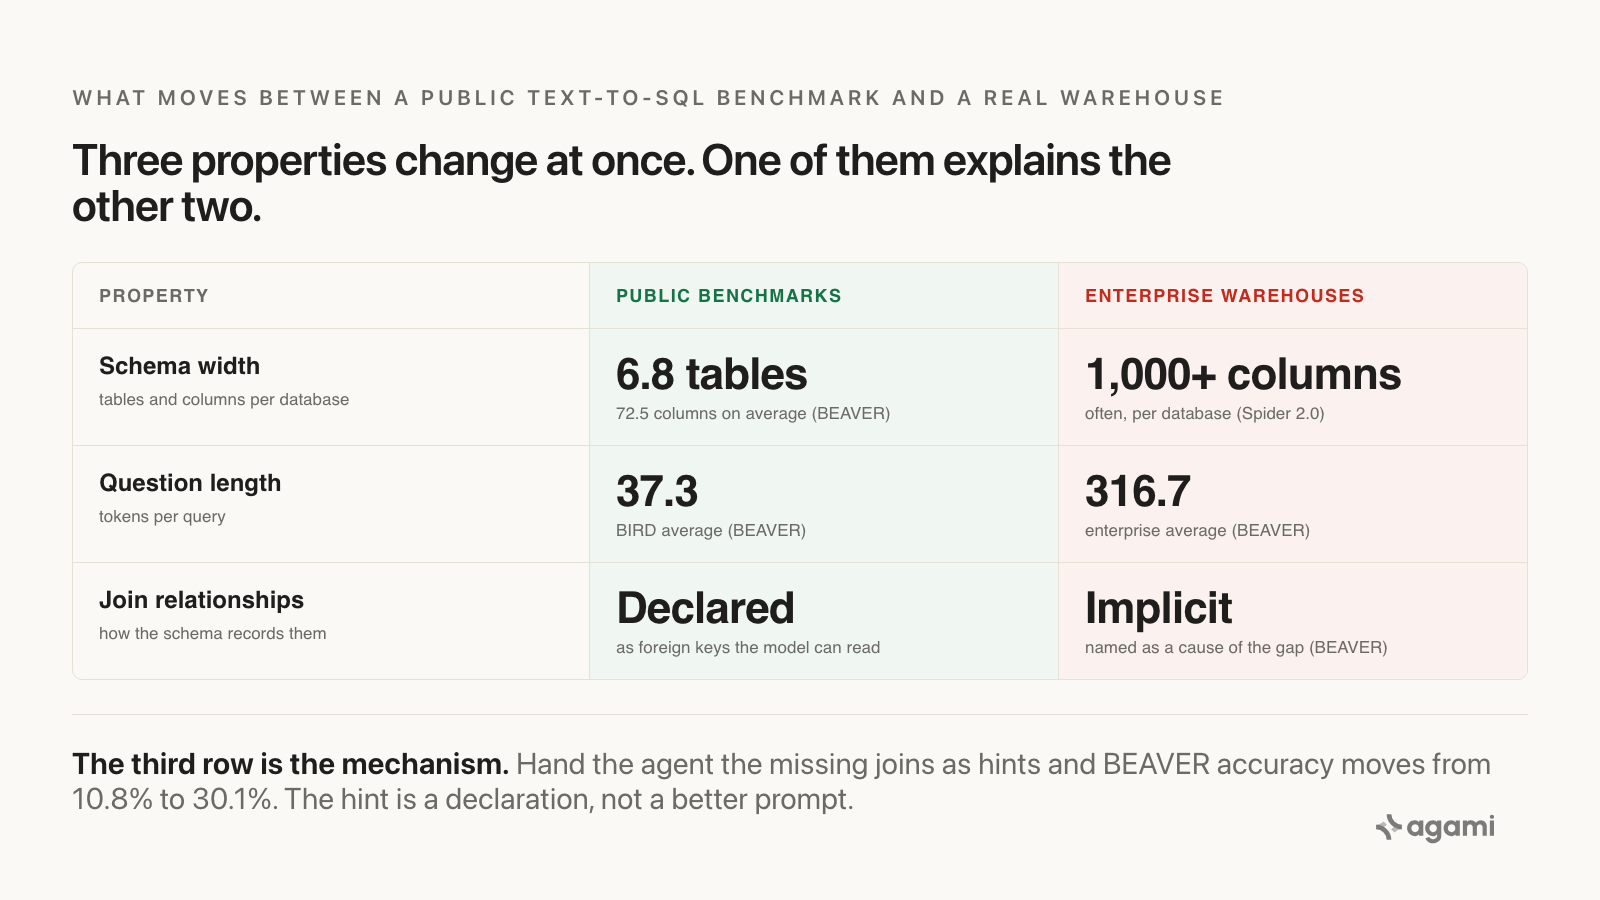
What moves between a public benchmark and a real warehouse. Figures from the BEAVER paper (arXiv:2409.02038v3) and the Spider 2.0 paper (arXiv:2411.07763).
The join that explains the gap
Here's the specific failure an undeclared join produces, and it catches people out. The query succeeds. A number comes back. The number is wrong.
Take two tables. One holds loans, one row each. The other holds payments, several rows per loan. Ask for the total amount loaned. If the generated SQL joins the two tables on the way to the sum, every loan is counted once per payment, and a loan with three payments contributes three times its amount to the total. The query is valid. The schema is valid. The total is wrong by an amount nobody can see, and the full worked example with the SQL is on this blog.
That's a fan trap. BEAVER's authors name implicit joins as a cause of the gap, and this is what that cause looks like on a real query. On a benchmark with declared foreign keys, the relationship is written down and the model, or the harness around it, can read that the join is one-to-many before it sums across it. On a warehouse that arrived through a replication connector, the relationship is not written down. Fivetran-replicated Salesforce, ServiceNow and NetSuite land with no foreign keys, so every join the business relies on is a convention in someone's head, and the ServiceNow case is a clean example of a join that looks like a key and is not one.
A model reading that schema sees two tables with a column name in common. It does not see that one side is the grain of the question and the other side will multiply it. The schema never carried that fact, so the model can only guess at it until someone writes it down. BEAVER's oracle hints are exactly that declaration, handed over by a person.
What these benchmarks are actually made of
A benchmark number is only as good as the data underneath it, and the ones in this post are made of different things. That difference is the argument, so it's worth being precise about.
Spider 1.0 and BIRD are built from public databases with well-structured schemas and, in the Spider 2.0 authors' description, simplistic question-SQL pairs. They're the friendly end.
Spider 2.0 is built from real enterprise workflows, which is where the 1,000-column schemas come from, per Lei et al.
BEAVER comes closest of the public benchmarks to an enterprise measurement. Its 9,128 question-SQL pairs come from real-world query logs across 812 tables in private data warehouses, per arXiv:2409.02038. Its authors are also candid about why nobody else has done this: enterprise query logs are scarce because of privacy constraints, so alongside the real logs they synthesise high-fidelity, expert-verified queries to get the dataset to a usable size. Even the best available enterprise benchmark is part real and part reconstruction, and the reason is that companies can't hand out their query history.
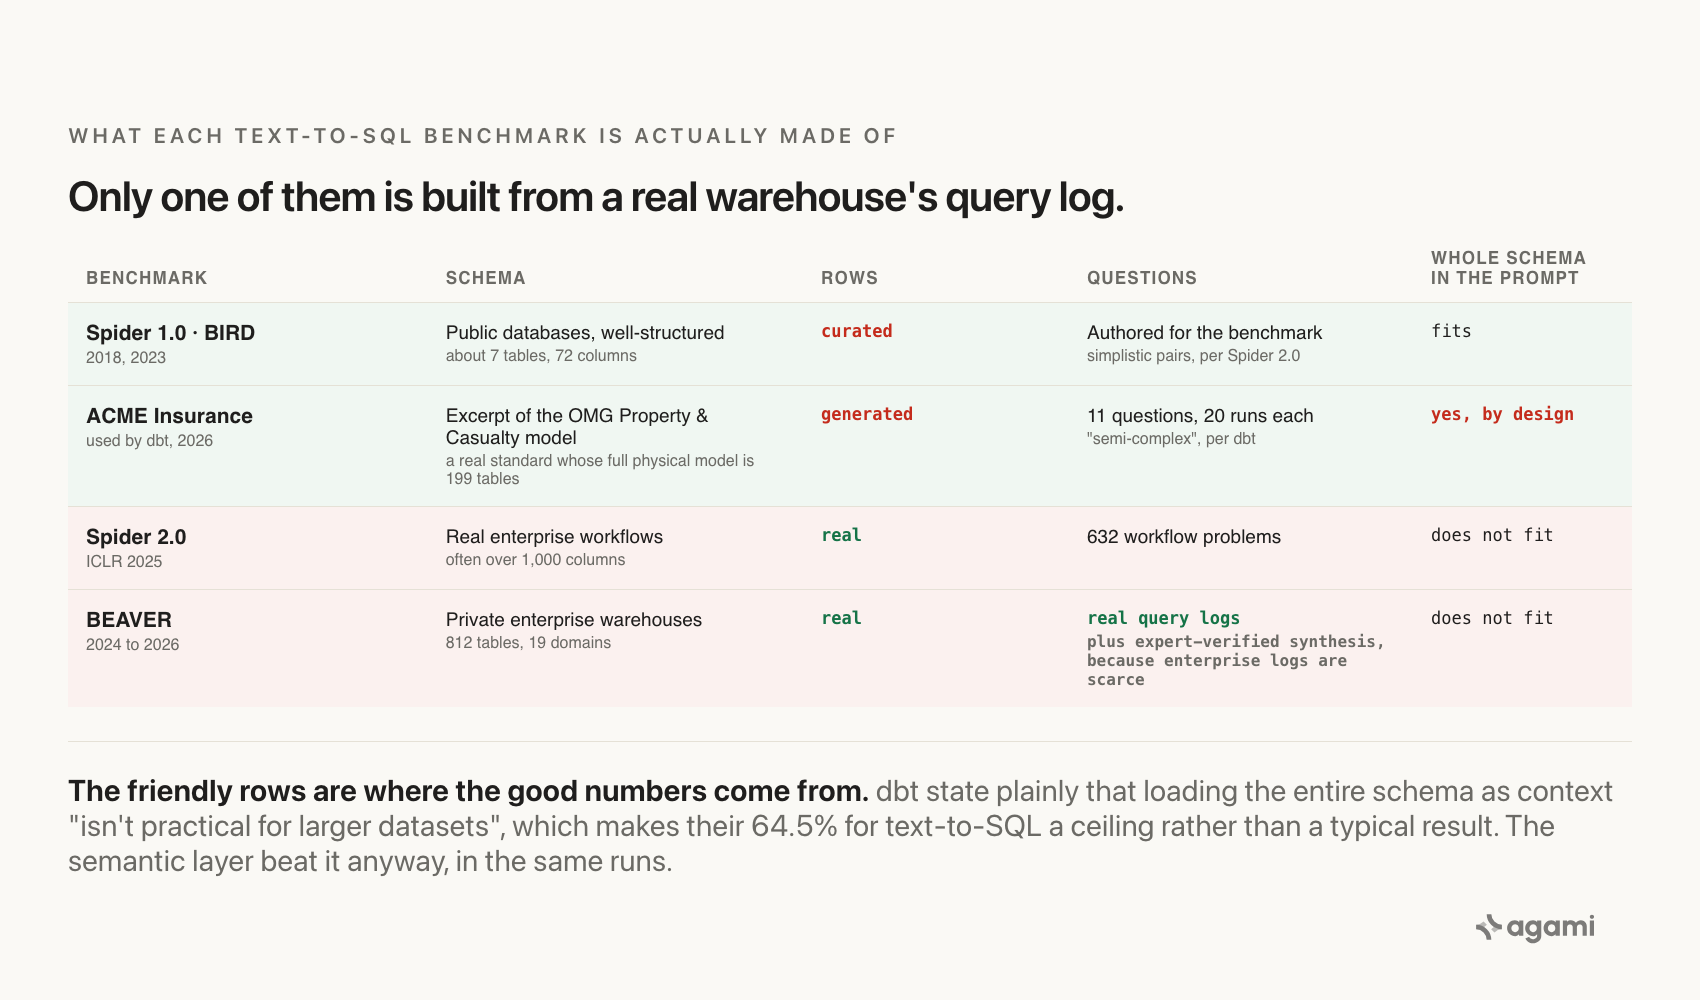
Only BEAVER is drawn from a real warehouse's query log, and even it synthesises some queries because enterprise logs are scarce. Sources: the Spider 2.0 and BEAVER papers, dbt's benchmark post, and the OMG Property and Casualty specification.
The dbt comparison is the friendly end again, and this matters for how you read it. Its ACME Insurance dataset comes from Juan Sequeda and colleagues at data.world, and its schema is an excerpt of the Object Management Group's Property and Casualty Data Model, a real insurance industry standard. But the full physical P&C model runs to 199 tables, the benchmark uses a small fraction of that, and the rows are generated rather than drawn from a live insurer. dbt describe it as semi-complex and meant to mimic real-world analytical problems, which is a fair description and not a claim about production data.
They also state the condition that makes their text-to-SQL number a ceiling rather than a typical result:
"To make text-to-SQL work, we loaded the entire schema as context, which isn't practical for larger datasets. Keep that in mind as you read the numbers."
Read that against the first half of this post. A schema small enough to paste whole into a prompt is the opposite of the enterprise case: 1,000 columns will not fit, and choosing which part to show the model is itself where the errors enter. So treat dbt's 64.5% as a favourable case, under a condition they flag themselves. The semantic layer still beat it by twenty points or more in the same runs.
Anthropic published a measurement on a real production warehouse, and the number is the interesting part. Anthropic's data team wrote up how they run self-service analytics on their own internal warehouse. Pointing Claude at that warehouse without the semantic layer and the skills that describe it, they report that accuracy "didn't exceed 21% on our evals." With them, "consistently above 95% in aggregate and regularly around 99% in certain domains."
Twenty-one percent, on a real company's production data. Spider 2.0, a benchmark built from enterprise workflows, put the same class of task at 21.3%. Those are two independent measurements, by different teams, using different models, on different data: one a benchmark, one a company's own warehouse. Read them carefully, though. Anthropic report a ceiling, "didn't exceed 21%", and Spider 2.0 reports a measured 21.3%, so the two are close without being the same kind of number. Together they still answer the reasonable objection that benchmarks are unrealistic: on this question, a company measuring its own warehouse landed about where the benchmark already sat.
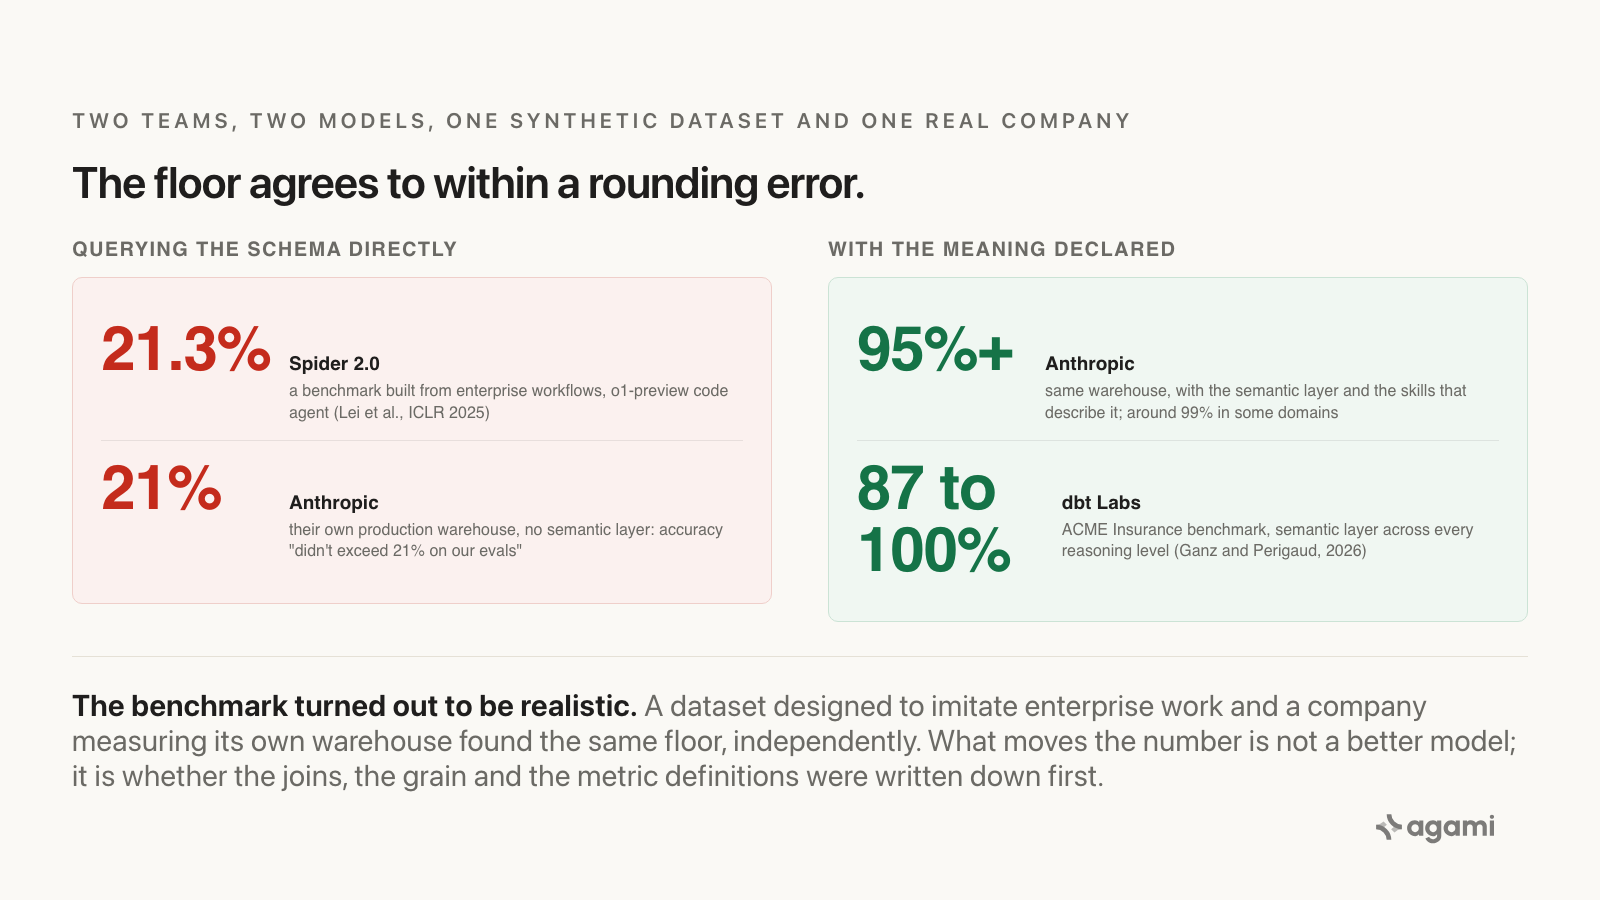
Two teams, two models, one benchmark and one company's own warehouse. Sources: the Spider 2.0 paper, Anthropic's engineering post, and dbt's 2026 benchmark.
Two things Anthropic report are worth more than the headline number, because both cut against the easy version of this argument. The first is that auto-generating the semantic layer did not work. In their words, having an LLM generate metric definitions from raw tables and query logs "produced plausible-looking definitions that encoded the very ambiguities we were trying to eliminate," and their recommendation is to "generate the documentation with Claude, but have a human own the definition." A semantic model is not something you can fully derive from the schema you already have, because the schema is what is missing the meaning. The second is the failure they say they have not solved: "The answer is wrong, but looks plausible and is used without objection." That is the fan trap again, named by the team with the strongest possible incentive to claim it fixed, and they say plainly "we don't have a robust solution yet."
For completeness on what is not production data: the April 2026 paired-benchmark paper from Rumiantsau and Fokeev found that a 4 KB markdown document of business conventions lifted accuracy by 17 to 23 points across three frontier models (arXiv:2604.25149), on the Contoso retail dataset. And we have no number of our own: our results are pending and this post does not offer one.
Why a bigger model does not close it
The obvious response is to wait. Models improve; the gap will shrink. The evidence says the gap has a floor.
dbt Labs ran the same comparison in 2026 on the ACME Insurance benchmark described above, and their published results (Ganz and Perigaud, dbt Labs, April 2026) show text-to-SQL accuracy roughly doubling between 2023 and 2026, from 32.7% to 64.5% in their harness. Over the same period a semantic layer, where the joins and metric definitions are declared and the engine writes the SQL, held between 87% and 100%. Turning the model's reasoning effort up didn't close the distance: in their runs the semantic layer stayed at 87 to 100 across every reasoning level, and text-to-SQL stayed between 50 and 65.
Those runs happened on a small schema loaded whole into the prompt, so treat 64.5% as the favourable case rather than the expected one. The trajectory is what matters here: three years of model progress moved text-to-SQL a long way and did not reach where a declared semantic layer already sat.
Those are dbt's numbers, on dbt's benchmark, and they are quoted here as theirs. The finding that matters is the shape of the failure, in their words:
"With text-to-SQL, failure looks like a plausible but incorrect answer. With the Semantic Layer, failure looks like an error message."
A semantic layer that can't ground a question returns nothing. A text-to-SQL model that can't ground a question returns a number. On a board deck, one of those is recoverable.
What "declared" means in practice
Write the joins down before any query runs. That place is a semantic model: the layer that tells an AI agent what your data means, which tables share a grain, and which relationship between two tables is one-to-one, one-to-many or many-to-one.
Once that is declared, the fan trap becomes checkable. Before generated SQL runs, a pre-flight can read the cardinality of every join in scope, find which table the SUM is reaching into, and either rewrite the query when exactly one safe form exists or refuse it and show the shape that would be right. The check is structural, so it holds on the hundredth query as firmly as on the first, whether or not anyone is paying attention that day. Governance does not live in the prompt; it lives in a declared fact the query has to pass.
It also changes what accuracy means. A leaderboard score on a public benchmark measures a model against a schema that already had its joins declared. Accuracy you can measure on your own warehouse means a set of golden datasets, questions with known answers against your tables, run every time the model or the semantic model changes, so that a query that starts triple-counting is a regression test failure and not a discovery in a meeting. Bring your own benchmark; the public one measured something you don't have.
Three things to check on your own warehouse
None of this needs a vendor. Three queries against the warehouse you already have tell you where you stand.
- Count the declared relationships. In most warehouses
information_schema.table_constraintswithconstraint_type = 'FOREIGN KEY'returns the joins the database knows about. On a replicated app schema the answer is usually zero. That's the number of joins an AI agent can read, as opposed to guess. - List the joins your reports actually use. Your BI tool's data model, or your dbt project, has them. Every one that is not in the first list is a relationship the business depends on and the warehouse has never been told.
- Ask one question with a known answer. Pick a total your finance team already trusts. Ask the AI tool for it against the raw schema. If the number comes back higher than the trusted one, find the join that fanned it. That's the seventy points, on your data, in one query.
What this looks like in Agami
Everything above holds whoever builds the model. Here's what it looks like in our product, in the same terms this post has used.
The cardinality is read from the warehouse. Introspection walks the warehouse and records every relationship it can establish from keys and grain, one-to-many included, into readable YAML that lives in your repo rather than inside a vendor's service. That is exactly the fact the fan-trap check needs, and exactly the one a replicated app schema never shipped.
The meaning is drafted, then owned by a person. Descriptions, entities and metric definitions are drafted from the schema, and then your team approves them, reversibly. Anthropic's finding applies to us with no discount: definitions generated from raw tables encode the ambiguities you were trying to remove. Drafting is cheap and approval is the part that can't be automated, so an unapproved metric is flagged on every answer that uses it.
A query that can't be grounded doesn't run. The pre-flight reads the declared cardinality of every join in scope before generated SQL executes, rewrites the query when exactly one safe form exists, and otherwise refuses it and shows the shape that would have been right. Every answer comes back with its SQL beside it, so you can see the join.
Accuracy is measured on your questions, not a leaderboard. A validated question and its known-correct answer become a golden test, and a change that breaks one is not promoted. That turns "bring your own benchmark" into a mechanism.
And the number we do not have. Our own benchmark results are pending, so this post quotes Anthropic, dbt and two papers and no figure of ours. When we have one, it will name the benchmark and the date. The honest position today is that the direction is well evidenced and our magnitude is unpublished.
Frequently asked questions
Q: Why does text-to-SQL score so much lower on Spider 2.0 than on Spider 1.0?
A: Spider 2.0 is built from real enterprise warehouse workflows rather than curated schemas. Its databases often exceed 1,000 columns, its questions are long, and its joins are frequently implicit rather than declared as foreign keys. The same o1-preview code agent that solves 91.2% of Spider 1.0 solves 21.3% of Spider 2.0, per Lei et al. (arXiv:2411.07763). The model is constant; the schema's declared structure is what changed.
Q: What is a fan trap in SQL, and why does an LLM make it more likely?
A: A fan trap is an aggregate taken across a one-to-many join, so the measure on the one side is counted once per row on the many side. The query is valid and returns a plausible number that is too high. A language model makes it more likely because the schema never records grain: the model sees two tables with a shared column name and nothing that says which side multiplies the other.
Q: Will a better model close the gap between public benchmarks and enterprise data?
A: The evidence suggests a floor. dbt Labs' 2026 benchmark (Ganz and Perigaud) shows text-to-SQL roughly doubling from 2023 to 2026 while a semantic layer held between 87% and 100%, and raising reasoning effort did not close the distance. The missing information is a declared join, and no model can recover a fact that was never in the schema.
Q: Are these benchmarks actually built from real enterprise data?
A: Only partly, and the differences matter. Spider 1.0 and BIRD use public databases with well-structured schemas. dbt's ACME Insurance uses an excerpt of the Object Management Group's Property and Casualty industry model with generated rows, and dbt loaded the whole schema into the prompt, which they note is not practical at larger sizes. BEAVER is the closest to the real thing: 9,128 question-SQL pairs from real query logs across 812 tables in private warehouses, though its authors also synthesised expert-verified queries because enterprise logs are scarce under privacy constraints. Anthropic is the most useful data point: they measured Claude on their own production warehouse and report accuracy no higher than 21% without a semantic layer and above 95% with one. That is a ceiling rather than a measured score, but it lands close to Spider 2.0's 21.3%, which suggests the benchmark is realistic on this question.
Q: What does a semantic model add that a bigger prompt does not?
A: A place where joins, grain and metric definitions are written down and enforced before a query runs. A pre-flight can read the declared cardinality of every join, detect an aggregate across a one-to-many relationship, and rewrite or refuse the query. That is a structural check rather than a prompt instruction, so it holds on the hundredth query as well as the first.
References
- Lei, F. et al., "Spider 2.0: Evaluating Language Models on Real-World Enterprise Text-to-SQL Workflows," arXiv:2411.07763, ICLR 2025 (oral). Source of the 21.3% / 91.2% / 73.0% figures, the 632 workflow problems, and the "often more than 1,000 columns" property.
- Chen, P. et al., "BEAVER: An Enterprise Benchmark for Text-to-SQL," arXiv:2409.02038v3. Source of 10.8% and 30.1% with oracle hints, 9,128 question-SQL pairs across 812 tables and 19 domains, the 6.8 tables / 72.5 columns public-benchmark average, 316.7 vs 37.3 tokens, and implicit joins named as a cause of the gap.
- Ganz, J. and Perigaud, B., dbt Labs, "Semantic Layer vs. Text-to-SQL: 2026 Benchmark Update," dbt Developer Blog, 7 April 2026. Source of the 32.7% to 64.5% text-to-SQL trajectory, the 87 to 100% semantic-layer range, the reasoning-effort result, and the "plausible but incorrect answer" quotation. Their figures, their benchmark.
- Yu, T. et al., "Spider: A Large-Scale Human-Labeled Dataset for Complex and Cross-Domain Semantic Parsing and Text-to-SQL Task," arXiv:1809.08887, EMNLP 2018. The Spider 1.0 benchmark.
- Li, J. et al., "Can LLM Already Serve as A Database Interface? A BIg Bench for Large-Scale Database Grounded Text-to-SQLs," arXiv:2305.03111, NeurIPS 2023. The BIRD benchmark.
- Sequeda, J., Allemang, D. and Jacob, B., "A Benchmark to Understand the Role of Knowledge Graphs on Large Language Model's Accuracy for Question Answering on Enterprise SQL Databases," arXiv:2311.07509. The origin of the ACME Insurance dataset dbt used, and the source of its schema: an excerpt of the OMG Property and Casualty Data Model with generated sample rows. Dataset at datadotworld/cwd-benchmark-data.
- Object Management Group, "Property and Casualty Data Model, version 1.0." The industry standard the ACME schema excerpts; its full physical model runs to 199 tables.
- Rumiantsau, M. and Fokeev, I., "Semantic Layers for Reliable LLM-Powered Data Analytics: A Paired Benchmark of Accuracy and Hallucination Across Three Frontier Models," arXiv:2604.25149, 28 April 2026. A 4 KB document of business conventions lifted accuracy 17 to 23 points across three frontier models, on the Contoso retail dataset.
- Anthropic Data Science and Engineering, "How Anthropic Enables Self-Service Data Analytics with Claude." The production-warehouse measurement: no higher than 21% without the semantic layer and skills, above 95% with them and around 99% in some domains; the failed auto-generation experiment; and the unsolved silent-failure mode.
- Agami, "The query we refuse to run." The fan-trap SQL and the cardinality pre-flight.
- Agami, "In ServiceNow, Incident and Task Are the Same Record." A replicated join that looks like a key and is not one.
Try Agami
Measure it on your own warehouse.
Agami builds the semantic model from your schema, declares every join's cardinality, and refuses the query that would fan out a total. Run it locally on your own machine, or talk to us about a benchmark on your data.