How to Query Salesforce Data with AI Without Double-Counting Your Pipeline
The QBR needs eight quarters of pipeline by product. Salesforce cannot produce it, so the data lands in a warehouse. There the same question overstates pipeline 2.5x and reorders the slide.

It is the week before the quarterly business review. The CRO wants the account-risk section, and one slide in it is easy to describe:
Pipeline by product line, trended over the last eight quarters.
The RevOps analyst does the sensible thing and files a request in the data team's ad-hoc channel. It joins a queue. Some version of that request is sitting in some version of that queue at most companies right now.
The reason it goes to the data team instead of into a Salesforce report is not laziness. It is that Salesforce structurally cannot answer it. Understanding exactly why is what tells you what to build instead, and it is also where querying Salesforce data with AI starts to go wrong.
Everything below was run against a synthetic Salesforce-shaped dataset of 538 open opportunities. The company is invented. The schema is real Salesforce shape, and every number on this page came out of a database.
Before you start
- Salesforce replicated into a warehouse, if you want to run the SQL. Postgres, Snowflake, BigQuery and Redshift all work.
No org? A Developer Edition org is free indefinitely, is not a trial, and ships with sample data, so the trap below is reproducible without loading anything. It gives two licences and a small storage allocation, and 180 days without a login marks it inactive and queues it for deletion. That was tightened from a year in 2022, so older advice is wrong.
Nothing in a warehouse yet? Fivetran and Airbyte both read through the Bulk API, so the connected user needs read access plus API access, which Developer Edition has on by default. Casing varies by extract tool.
1. Where Salesforce stops
Salesforce reporting is good. For most questions that live inside the CRM, the report builder wins and you should use it. There is even a standard "Opportunities with Products" report type that handles the deal-versus-line-item distinction correctly, which is the exact trap we hit later in this post.
But the QBR slide asks for two years of history, and that runs into hard limits rather than awkward ones.
The cut you want is not on the object being tracked. Historical trending snapshots fields on a single object, and Opportunity is one of the supported ones. But the product on a deal is not a field on Opportunity. It lives on the line item, a level below. So "pipeline by product, trended" is not a report you are configuring badly. It is not a shape the feature produces, and no amount of admin skill changes that.
That matters more than it first sounds, because a CRO never asks for one number. They ask for the trend and then for the cuts: by product line, by segment, by region. Each cut is another dimension the native feature has to reach, and this is where it stops reaching.
A historical trend report holds five snapshot dates. That is the documented cap, alongside four historical filters. Eight quarters needs eight points on the line, so even the top-line trend does not fit in one report.
Formula fields are excluded. Salesforce documents that formula fields are not supported for historical trending. Supported types are number, currency, date, picklist and lookup. If your derived revenue logic lives in a formula field, which is where most teams keep it, it cannot be trended at all.
And you cannot export it. Historical trending reports cannot be exported, and the summary format is not supported. A slide in a QBR deck requires an export.
Retention is measured in months, not years. The trend window is deliberately short, and even the most generous configuration on Opportunity is reported to top out around a year. Two years of history was never being kept in a trendable form.
Report types cap at four objects deep. A report type traverses a maximum depth of four objects, and a report drawing columns from more than twenty objects errors out.
None of this is a knock on Salesforce. These are reasonable boundaries for an operational system. But they mark a real line, and Salesforce will tell you where that line is if you look at what it sells you next.
2. What Salesforce sells you when you cross that line
The most reliable evidence for where a product stops is what the vendor builds to get past it.
At Dreamforce 2025, Data Cloud was renamed Data 360 and positioned as the unified data layer that gives agents context across clouds and external sources. Alongside it, Salesforce shipped Tableau Semantics, which translates raw data into business language and enforces consistent metrics across clouds through the Customer 360 Semantic Data Model, explicitly standardizing semantics across Databricks, dbt and Snowflake.
Read those as product decisions and they say two things plainly. Salesforce built Data 360 because the CRM cannot answer questions that span sources. And Salesforce built Tableau Semantics because an agent pointed at raw CRM data is not accurate enough without a semantic layer on top of it.
The second one deserves a moment if you are evaluating AI on your CRM. The largest enterprise software company in the world looked at putting agents on its own data and concluded it needed a governed semantic layer first. That is not a marketing position. That is a build decision.
3. So the data moves, and the guardrail does not move with it
Faced with the QBR slide, the data team does what data teams do. Salesforce gets replicated into the warehouse on a schedule, history accumulates, and eight quarters becomes a WHERE clause.
Here is the part almost nobody accounts for. The report-type layer does not come with it.
Inside Salesforce, "Opportunities with Products" was quietly protecting you. Someone at Salesforce defined that report type at the line-item grain, so "pipeline by product" could not silently double-count. In the warehouse you have opportunities and opportunity_line_items as raw tables and nothing is protecting the grain at all.
Now point an AI agent at those tables and ask the QBR question. It writes the obvious query:
SELECT p.name AS product,
       SUM(o.amount) AS pipeline
FROM opportunities o
JOIN opportunity_line_items oli ON oli.opportunity_id = o.id
JOIN products p ON p.id = oli.product2_id
WHERE o.is_closed = false
GROUP BY p.name
ORDER BY pipeline DESC;
That returned a clean, well-formatted table:
| Product | Pipeline |
|---|---|
| Calibration Toolkit | $13,866,530 |
| Spare Parts Bundle | $12,081,360 |
| Installation & Commissioning | $11,560,600 |
| VisionScan 660 3D Vision System | $11,541,470 |
| FieldGate 500 Industrial Gateway | $11,404,560 |
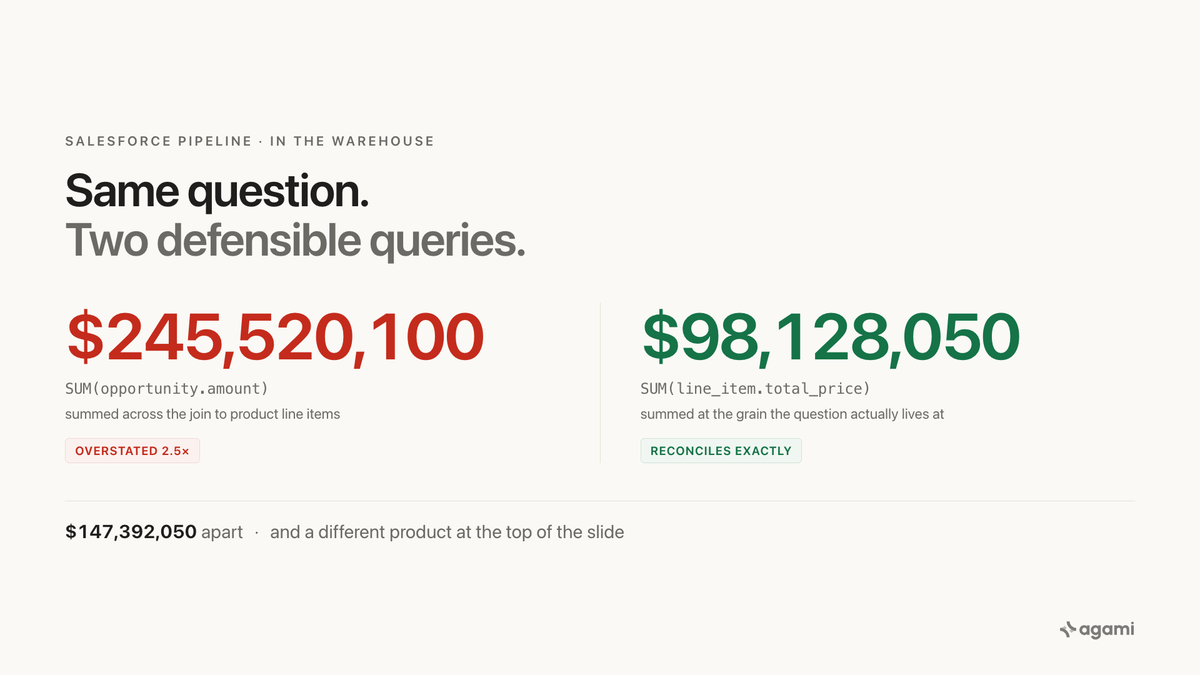
Total across all 25 products: $245,520,100.
The real open pipeline is $98,128,050.
The query overstated it by $147 million, and nothing in the output said so. No warning, no null, no failed constraint. Valid SQL, valid join, every product name spelled correctly.
4. Why it inflates, and how far
Opportunity.Amount is one value at the deal grain. OpportunityLineItem is a child table, one row per product on the deal. That is a one-to-many, so joining across it duplicates every opportunity row once per line item it owns, and SUM(o.amount) then adds the same deal once per product on it.
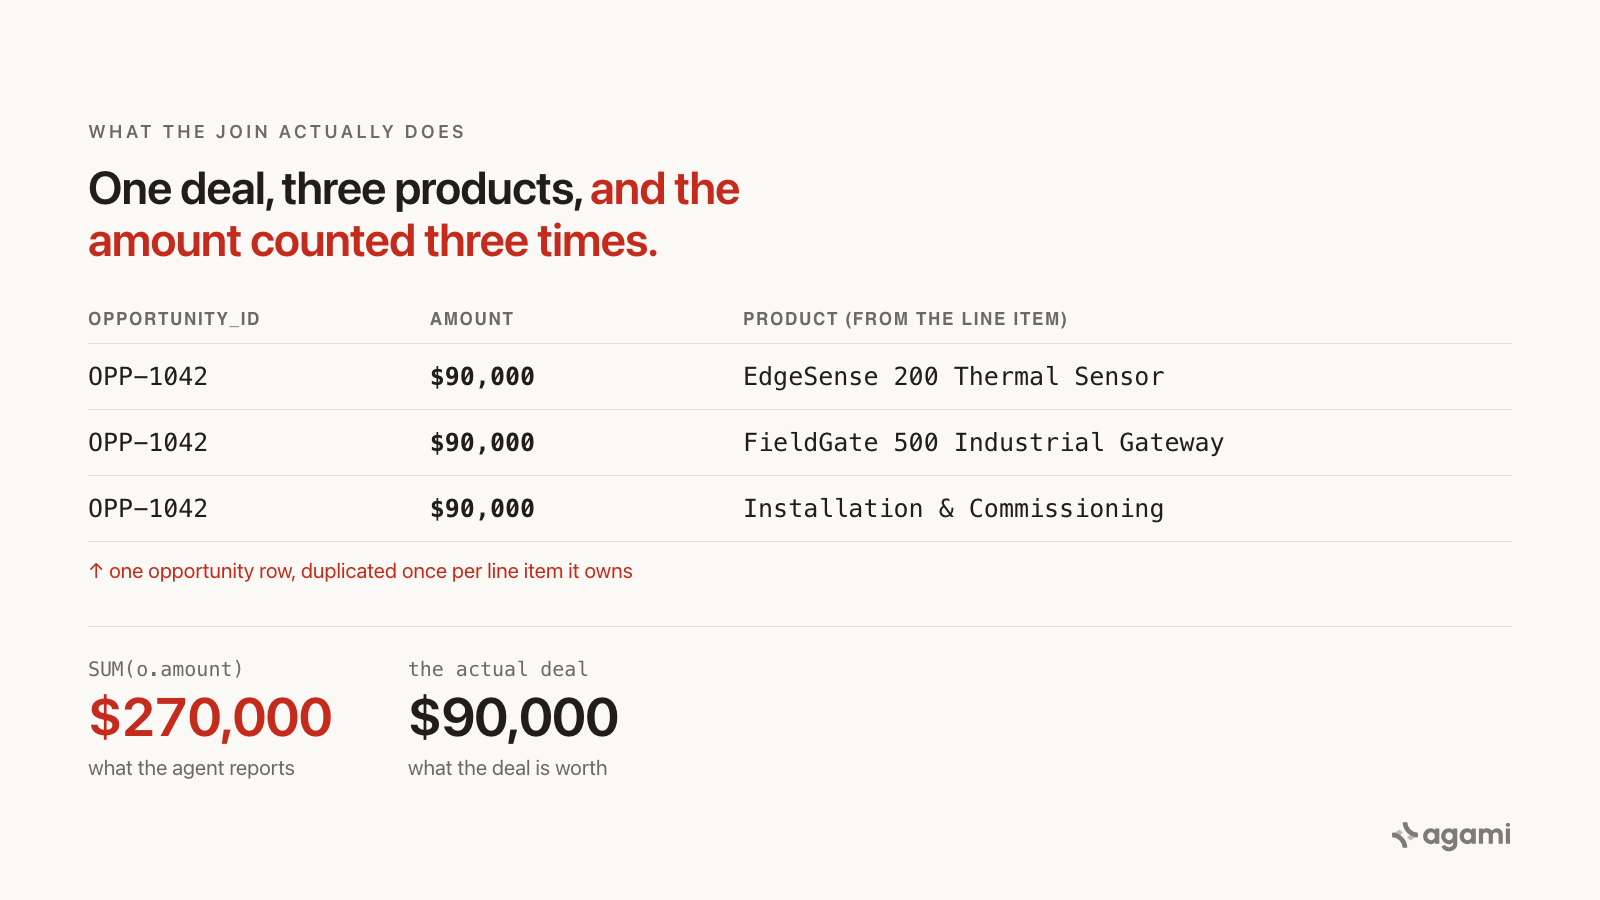
A single deal carrying three products becomes three rows, each still holding the full deal amount.
The size of the error is not mysterious. It is exactly the fan-out:
| Open opportunities | 538 |
| True open pipeline | $98,128,050 |
| Rows after joining line items | 1,347 |
| Average line items per opportunity | 2.50 |
Sum of amount across the join |
$245,520,100 |
| Inflation multiple | 2.50 |
The inflation multiple and the average line-item count are the same number to two decimal places, because they are the same number. Every deal got counted once per product on it.
The part that actually breaks the slide
An inflated total is embarrassing. A reordered ranking is worse, because a QBR slide is not read for its total. It is read for what is at the top.
Summing at the correct line-item grain gives a different answer and a different order:
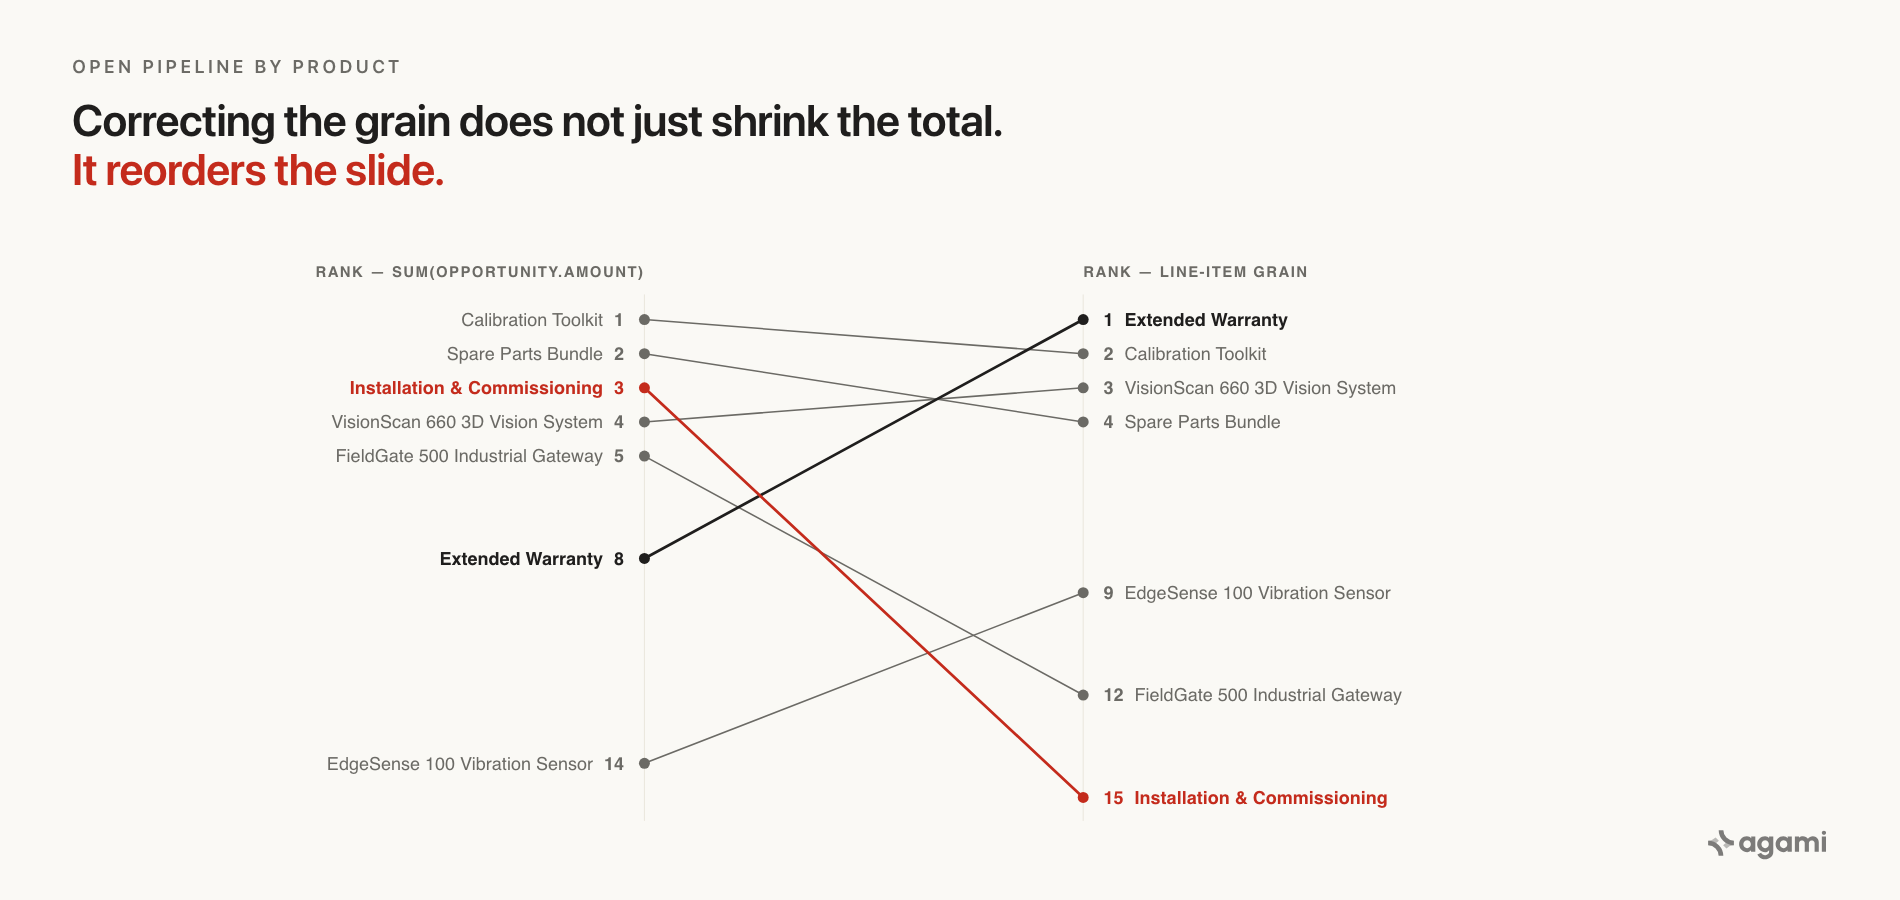
Every product's rank under the inflated sum, against its rank at the correct grain.
| Product | Rank (inflated) | Rank (correct) | Moves |
|---|---|---|---|
| Extended Warranty | 8 | 1 | up 7 |
| Calibration Toolkit | 1 | 2 | down 1 |
| VisionScan 660 3D Vision System | 4 | 3 | up 1 |
| Spare Parts Bundle | 2 | 4 | down 2 |
| EdgeSense 100 Vibration Sensor | 14 | 9 | up 5 |
| FieldGate 500 Industrial Gateway | 5 | 12 | down 7 |
| Installation & Commissioning | 3 | 15 | down 12 |
The product line that looks like your third biggest is actually your fifteenth. Your genuine number one looks eighth and would not make the slide at all.
The reason is that the inflation is not uniform. A product attached to big multi-product deals inherits that whole deal amount once for every other product on it, so accessories and services ride up on the hardware they are bundled with. Installation & Commissioning is not a large revenue line. It is a line that appears on large deals.
The correction
Pipeline by product is a line-item question, so it has to be answered at the line-item grain. Changing one expression does it:
SELECT p.name AS product,
       SUM(oli.total_price) AS pipeline
FROM opportunities o
JOIN opportunity_line_items oli ON oli.opportunity_id = o.id
JOIN products p ON p.id = oli.product2_id
WHERE o.is_closed = false
GROUP BY p.name
ORDER BY pipeline DESC;
That totals $98,128,050, which reconciles exactly to the true open pipeline. That exact reconciliation is the tell that you have found the right grain: the line items sum to the deal, so summing them once per product neither double-counts nor drops anything.
Both queries are valid SQL against the same schema. Neither is a bug. The difference between them is knowing which grain the question lives at, and that knowledge is not in the schema.
5. Why a person has to be in the loop
It is tempting to believe this is solvable by pointing better software at the database. Introspection is genuinely good now. It will find your tables, your columns, your primary keys, and it will usually infer the relationship between an opportunity and its line items without help.
None of that answers the question that actually mattered here.
Both of the queries above used real tables and a correct join. What separated the right answer from the $147 million wrong one was knowing that when this company says "pipeline by product", they mean the line-item grain and not the deal roll-up. That is not a property of the schema. It is a fact about the business, and the only place it exists is in the head of someone who works there.
The same goes for the second thing raw schema will not tell you: which fields carry meaning. Salesforce custom fields are suffixed __c, and even a stock Salesforce org ships with a handful on the opportunity:
delivery_installation_status__c
tracking_number__c
order_number__c
current_generators__c
main_competitors__c
Nothing in main_competitors__c announces that it is how your team segments competitive deals. Introspection finds the column. It cannot find the meaning. In a real org carrying a hundred of these, that gap is most of your business logic.
So the reliable version of this is not "point AI at the warehouse", and it is not "have the data team hand-write every query forever". It is a semantic model the machine drafts and a person corrects. Introspection proposes the tables, the relationships and the candidate metrics. Someone who knows the business confirms the grain, fixes the definitions that are wrong, and names what the custom fields actually mean. Once that is written down, every future question resolves against it, including the ones asked by people who have never heard the word "grain", and it answers them in the same conversation they were already having rather than in a tool they have to be trained on.
That review step is the difference between an agent that is confidently wrong and one you can put in front of a CRO. The next post in this series walks through building one, step by step, against Salesforce data already replicated in your warehouse.
6. The check you can run this week
You do not need any of that to find out whether you already have the problem. Take any breakdown your team currently reports out of replicated Salesforce data, whether it is pipeline by product, bookings by region or revenue by segment, and run two queries.
First the breakdown itself. Then the same measure with no join at all.
If the totals do not match, the breakdown is counting something more than once, and the ranking your leadership is reading is not the ranking in your business. That reconciliation is the cheapest audit available to you, and it fails more often than anyone expects.
7. How we build the model, and how to try it today
The loop we use at Agami is deliberately unglamorous.
Point it at the database and it introspects what is actually there: tables, columns, keys, the relationships and their cardinality, and the columns that look like they hold personal data. It then drafts the rest, the descriptions, the entities and the candidate metrics, on the theory that a first draft you can argue with beats a blank file.
Then it stops and asks you.
That pause is the point. Someone who knows the business walks the draft and settles what the schema cannot say: that pipeline by product is a line-item measure and not the deal roll-up, that main_competitors__c is how the team segments competitive deals, that two of the proposed metrics are the same real definition wearing different names. What you sign off is recorded, so an answer can tell you whether the numbers behind it rest on a definition someone approved or on one nobody has looked at yet. A change that would break the model does not get written.
After that the model is the contract. The same question asked six different ways by six different people resolves the same way.
Two minutes, no database, no infrastructure
You can watch this exact failure without connecting anything. The sample that ships with agami-core has a fan trap built into it deliberately, because it is the first thing that bites anyone pointing an agent at real tables:
/plugin marketplace add AgamiAI/agami-core
/plugin install agami-core@agami
/agami-connect sample
No database, no credentials, no deployment, and nothing leaves your machine. Ask it something that crosses the trap and watch what it does with the grain.
When you want it on your own Salesforce replica, the change is dropping one word:
/agami-connectIt introspects your warehouse, drafts the model, and hands you the review. Run locally, it stays local. Standing it up so the rest of the business can ask without going through you is a separate step, and an optional one.
What this looks like in every other app
The specifics are Salesforce. The shape is not.
Every enterprise application stores the same business fact at more than one grain, keeps only a shallow window of history, and hides its real meaning in fields the schema cannot describe. ServiceNow does it with table inheritance, where incident extends task and the relationship is not a foreign key at all. NetSuite does it across transactions and transactionlines.
And the QBR slide that started this was only the Salesforce half. The full account-risk question, the one that actually decides which customers get attention, spans the CRM, the service desk and the ERP at once: which accounts grew revenue year over year while their incident volume climbed and their receivables aged. No single application can answer that, which is where this series goes after the tutorial.
Bring us your worst QBR question.
The one where two teams quote different pipeline numbers and both can defend the query. We will trace it against your object model and show you which grain each answer is counting.
Book a demo or run it yourself on the OSS →
Frequently asked questions
Why not just run this in Salesforce? For most in-CRM questions you should. This one asks for eight quarters of trended history, and a historical trend report is capped at five snapshot dates, excludes formula fields and cannot be exported. The question leaves Salesforce because Salesforce cannot hold it, not because the report builder is weak.
Does this mean Opportunity.Amount is the wrong field? No. It is exactly right for total open pipeline with no product breakdown, and it produced the correct $98,128,050 when summed without joining. It becomes wrong only when a join to a finer grain is introduced underneath it.
Can an AI work out the correct grain on its own? It can usually infer the relationship, and that is not the hard part. Both queries here joined correctly. Deciding that "pipeline by product" means the line-item grain rather than the deal roll-up is a statement about how the business defines a number, and the schema does not contain it. Someone has to say it once.
We use custom objects, not standard ones. Does any of this apply? More so. Custom objects and __c fields are the part of your org that no vendor's pre-built model knows anything about, which makes them the part most dependent on a semantic model you own.
References
- Limits on Report Types, Salesforce Help
- Reports and Dashboards Limits and Allocations, Salesforce Help
- Salesforce Object Reference: OpportunityLineItem
- Agentforce 360 and Data 360 announcement, Salesforce
src_salesforce.yml, Fivetran's Salesforce connector source definition. Apache-2.0. Documents all 485 columns, and carries the Amount roll-up sentence verbatim. The Salesforce Object Reference page cited above returns HTTP 403 to a fetcher, so this is the readable copy.- agami-core on GitHub